Optimal Performance
Building Analysis
Exploring different methods to evaluate building performance.
Designing a commercial space of my choosing by selecting the optimum orientation to achieve visual comfort, low energy-use intensity and other factors. This was done using a multiple software, some among them being ladybug, honeybee, colibri, octapus, tt toolbox, and dragonfly. The data was collected using databases such as EnergyPlus and Therm. In this assignment I designed two spaces and ran the related analysis to determine the optimal design for the site which is located in Philadelphia. The result is that at each point, subsequent analysis influences the final design of the project. Case 1 is a single storey structure and Case 2 is double storey. Both designs were run through external software like Design Explorer.
Site
Location: Philadelphia
Site Footprint: 400m2
Program: Open Office
Case 1
Program: Open Office
No. of Floors: 1
Area of Program: 200m2
Floor Height: 5m
Energy Use Intensity: 188.10 kWh/m2
Useful Daylight Illuminance: 71.27%
Predicted Mean Vote: -0.61
Percent of People Dissatisfied: 12.77%
Case 2
Program: Open Office
Number of Floors: 2
Area of Each Floor: 100m2
Floor Height: 5m
Perimeter Depth: 2.5
No. of Zones: 5
No. of Perimeter Zones: 4
Energy Use Intensity: 188.10 kWh/m2
Useful Daylight Illuminance: 71.27%
Predicted Mean Vote: -0.61
Percent of People Dissatisfied: 12.77%
Material Properties
Wall: Exterior Wall
R Value of Wall: 2.18
U Value of Wall: 0.46
Floor: Interior Floor which is adiabatic
R Value of Floor: 0.69
U Value of Floor: 1.45
Floor is Adiabatic
Ceiling: Interior Ceiling which is adiabatic
R Value of Ceiling: 0.69
U Value of Ceiling: 1.45
HVAC Systems: Ideal Air Loads
Window: Exterior Window
R Value of Window: 0.42
Solar Heat Gain Co-efficient: 0.4
Window to Wall Ratio: 0.4
Reflectance of Shading Device: 0.65
Glazing Visible Light Transmittance: 65%
Transmittance of Shading Device: 0
Emissitivity of Shading Device: 0.9
Thickness: of Shading Device 0.25m
Depth of Shading Device: 1.5m
Material Properties
Wall: ASHRAE 189.1-2009 EXT WALL WOOD FRAME CLIMATE ZONE 6-8
R Value of Wall: 3.68
U Value of Wall: 0.27
Floor: Interior Floor which is adiabatic
R Value of Floor: 0.69
U Value of Floor: 1.45
Floor is Adiabatic
Ceiling: Interior Ceiling which is adiabatic
R Value of Ceiling: 0.69
U Value of Ceiling: 1.45
HVAC Systems: Ideal Air Loads
Window: ASHRAE 90.1-2007 EXTWINDOW NONMETAL CLIMATEZONE 5-6
R Value of Window: 0.50
Solar Heat Gain Co-efficient: 0.3
Window to Wall Ratio: 0.4
Reflectance of Shading Device: 0.65
Glazing Visible Light Transmittance: 65%
Transmittance of Shading Device: 0
Emissitivity of Shading Device: 0.9
Thickness: of Shading Device 0.25m
Depth of Shading Device: 1.5m
Climate Analysis
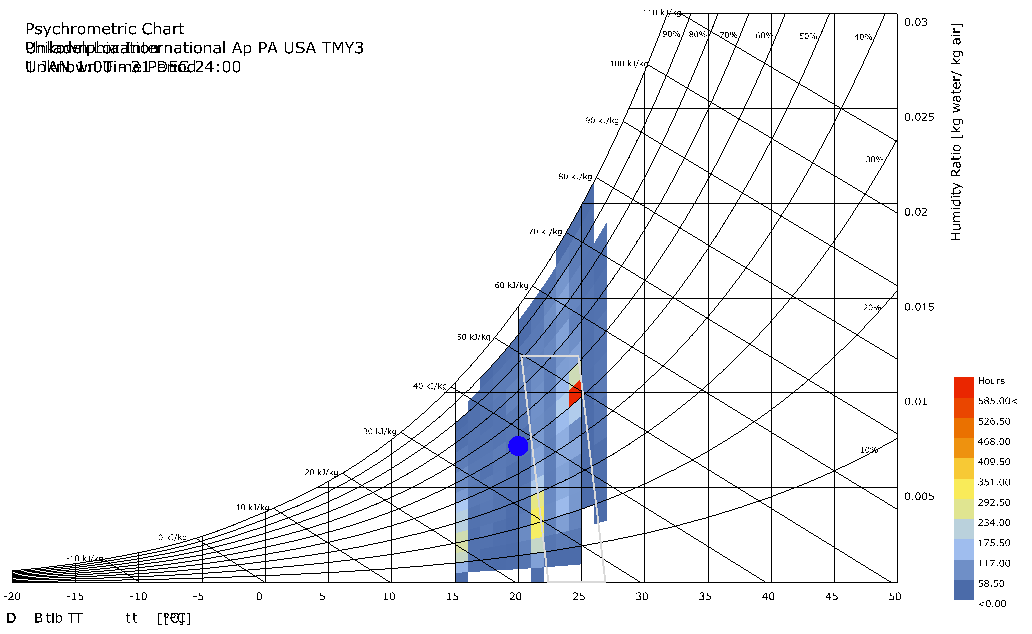
The site in Philadelphia receives fast and cool winds from predominantly the northwesterly to southwesterly directions. Spaces that require or function more efficiently with the use of natural ventilation should be orientated accordingly. Openings or energy-efficient systems such as wind tunnels, jump ducts, etc should be oriented towards the west. This will also promote natural cross-ventilation and ensure that the stale air is flushed out periodically. A long, narrow floor plan will encourage cross- ventilation as well. Adequate cross- ventilation will ensure that comfortable indoor air temperatures and will also reduce heat gain. Use materials with a high thermal mass (e.g., concrete, masonry, adobe, etc.) in a space that is naturally cooled at night due to outdoor temperatures. The material will provide cool indoor surfaces and temperatures the following day. This will help to reduce or eliminate air conditioning.
Philadelphia receives a moderate amount of rain from July to September. The materials used in construction must not be too porous as to allow seepage of water indoors. The roof must be thoroughly insulated and strong enough to withstand the effects of the rain. Forceful monsoon winds are expected. Lightweight elements of the exterior structure such as the shingles on the roof must be fastened well.
For half the year, between June to September, the air is humid and sticky. For the rest of the year, the air is dry. The type of insulation that is provided to the structure is highly subjected to the dew point temperature. The comfort and health of users in the home and workplaces is also dependent on the dew point. It can also cause physical hazards like slip hazards and respiratory issues.
The summer months, i.e from June to September, is when the relative humidity is the highest. Heat gain from lights, people, and equipment greatly reduces mechanical heating needs during the winter. But this also increases heat gain during the summers, so keep the structure well insulated. Orient the long side away from the hot western sun to limit heat gain during the warmer months of the year. Ensure the sides of the structure facing the south are glazed. Solar glazing admits direct sunlight into a space for passive heating in winter. However, overhangs should be provided to limit direct sunlight and heat gain during the summer months. Use permeable concrete surfaces and grass block pavers, and a top slab covered with highly refractory material, thus reducing the need for air conditioning. Insulating blinds, heavy draperies, or operable window shutters will help reduce winter night time heat losses from November to February. External sliding screens, louvers should be provided to control glare and heat. The users could manually operate the windows and slide the screens when they wish to. This short term experience translates into long term comfort and reduced energy use. Long term effects include improved health of the occupant.
Provide a sunroof, patio, veranda or sun space that can directly be heated by sunlight. The heat can then be transferred to a common mass surface that will heat the space during the cooler months of the year. During summers, the sun space influences the occupants’ physical experience, such as fluctuating temperatures and exposure to heat and sunlight. The size of the glazing space should be determined by the size of the floor plate that would be impacted. Openings such as windows and doors can also be used to transfer heat between spaces. Interior spaces need different levels of lux and heat depending on their function. So passive shading devices such as trees can be used in open indoor spaces, over automated, mechanical devices. Interior spaces can be well insulated and shaded by large overhangs and a secondary facade element. The secondary facade element would serve as a light sieve. They would receive diffused light and can be protected from direct heat gain.
2. Sensitivity Analysis - Daylight
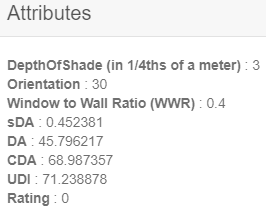
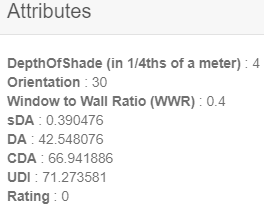
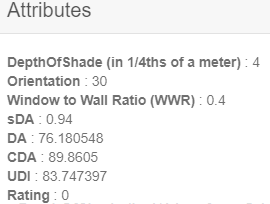
OBJECTIVE: To design an open office split across two levels. Followed by analysis of both levels separately, to understand how each of them receives daylight and identify the optimal scenarios for both individually and choose one scenario that behaves best for both.
Case 1
[All cases are oriented north]
Length of Space: 15m
Breath of Space: 13.33m
Height of Space: 5m
CONCLUSION: The best results are observed when the depth of the shading device is 1m.
Case 2
[All cases are oriented north]
Length: 10m
Breath: 10m
Floor Height: 5m
No. of floors: 2
Total floor area: 200m2
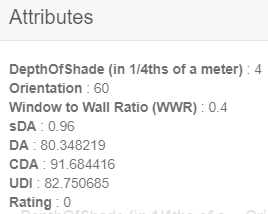
CONCLUSION: The 30° orientation is the best case for both the floor plates. Both the floors require shading devices with a depth of 1m.
3. Radiation Analysis and PV Panels
Case 1 did not have the minimum height required to effectively use PV panels hence the analysis was run for only Case 2
Cost of energy produced: $290.48
Solar Radiation before Shading: 275047.55 kWh/m2
Solar Radiation after Shading: 210929.73 kWh/m2
Surface tilt angle: 60°
Cost of 1 kWh: $0.1
Number of panels: 25
Area of each panel: 1.18 m2
Active surface area for each panel: 1.06 m2
System size of each panel: 0.11 kWh
Module Efficiency Percentage: 15%
4. Energy Performance
Case 1
Energy Balance With Storage Chart
Floor Normalized Cooling Load for Building: 12.65 kWh/m2
Floor Normalized Heating Load for Building: 100.67 kWh/m2
Floor Normalized Electric Lighting Energy for Building: 38.30 kWh/m2
Floor Normalized Electric Equipment Energy for Building: 36.25 kWh/m2
Energy Use Intensity: 188.10 kWh/m2
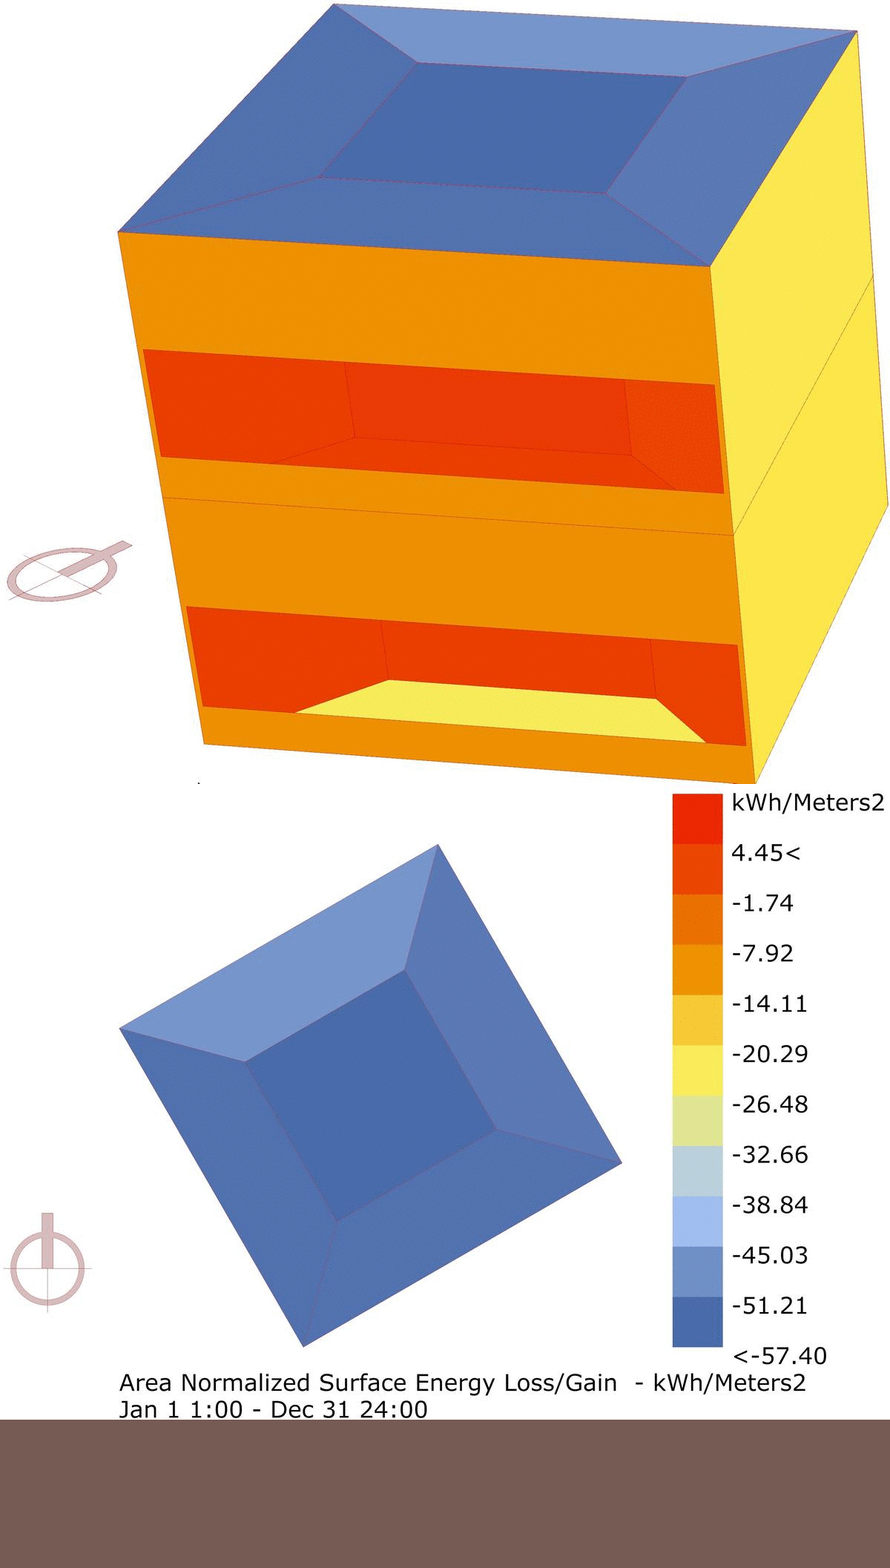
Surface Heat Gain
Case 2
Energy Balance With Storage Chart
Floor Normalized Electric Lighting Energy for Building: 38.30 kWh/m2
Floor Normalized Electric Equipment Energy for Building: 36.25 kWh/m2
Energy Use Intensity: 209.59 kWh/m2
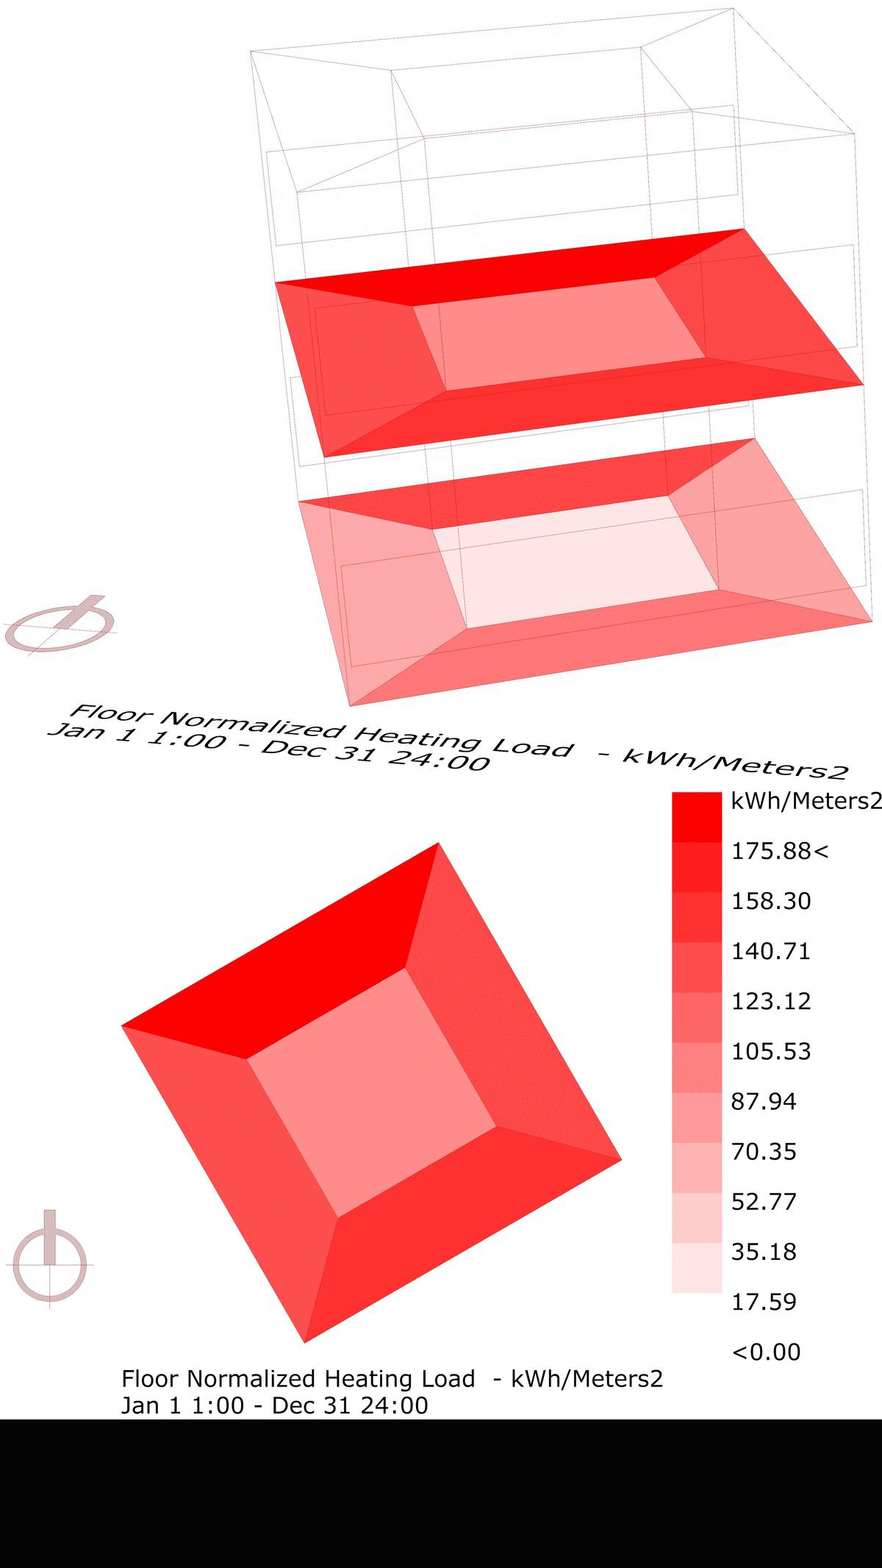
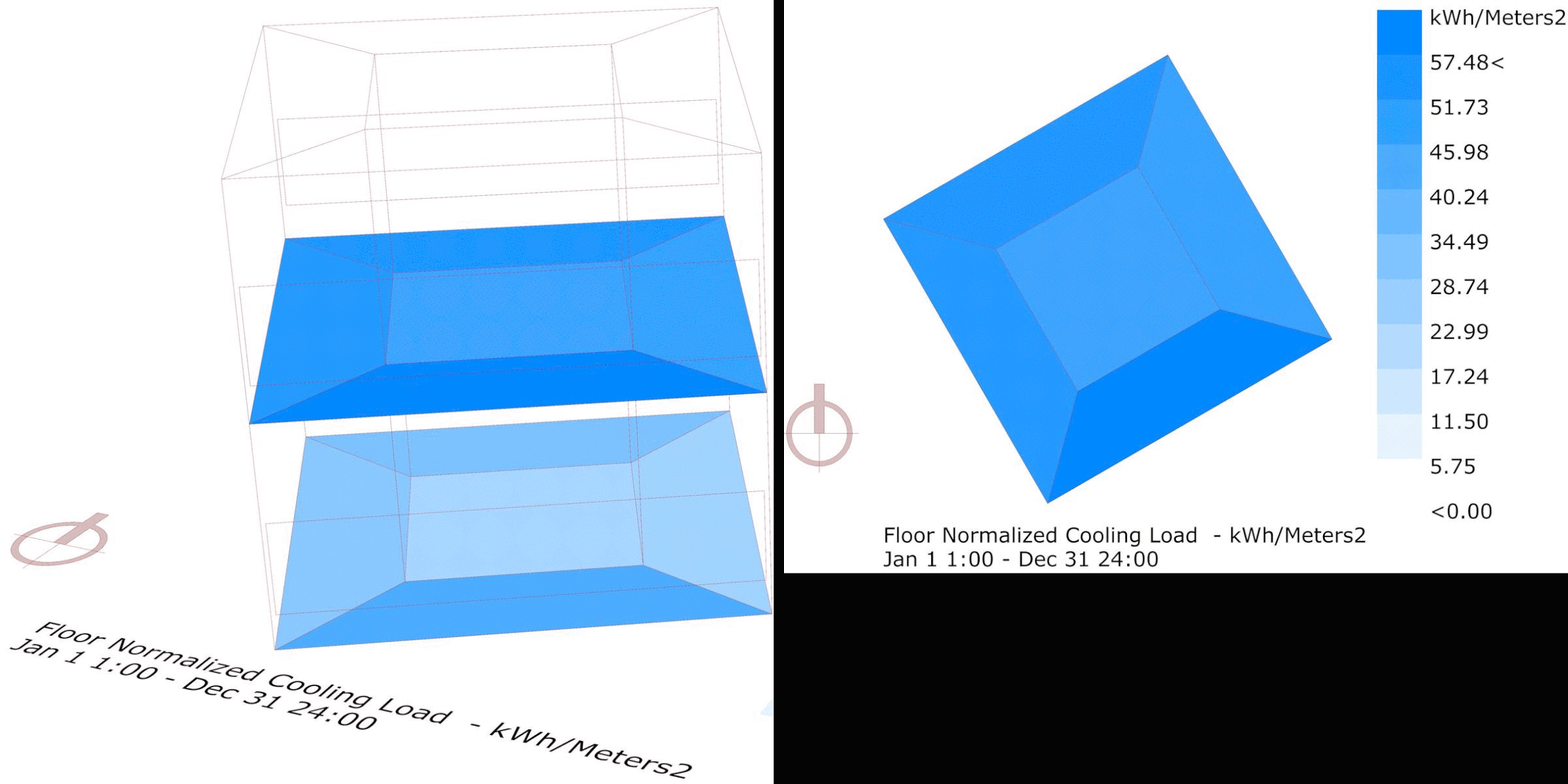
Floor Normalized Cooling Load for Building: 37.80 kWh/m2
Floor Normalized Heating Load for Building: 97.21 kWh/m2
5. Indoor Thermal Comfort
Case 1
[All cases are oriented north]
Material Properties
Average Predicted Mean Vote: -0.61
Average Percent of People Dissatisfied: 12.77%
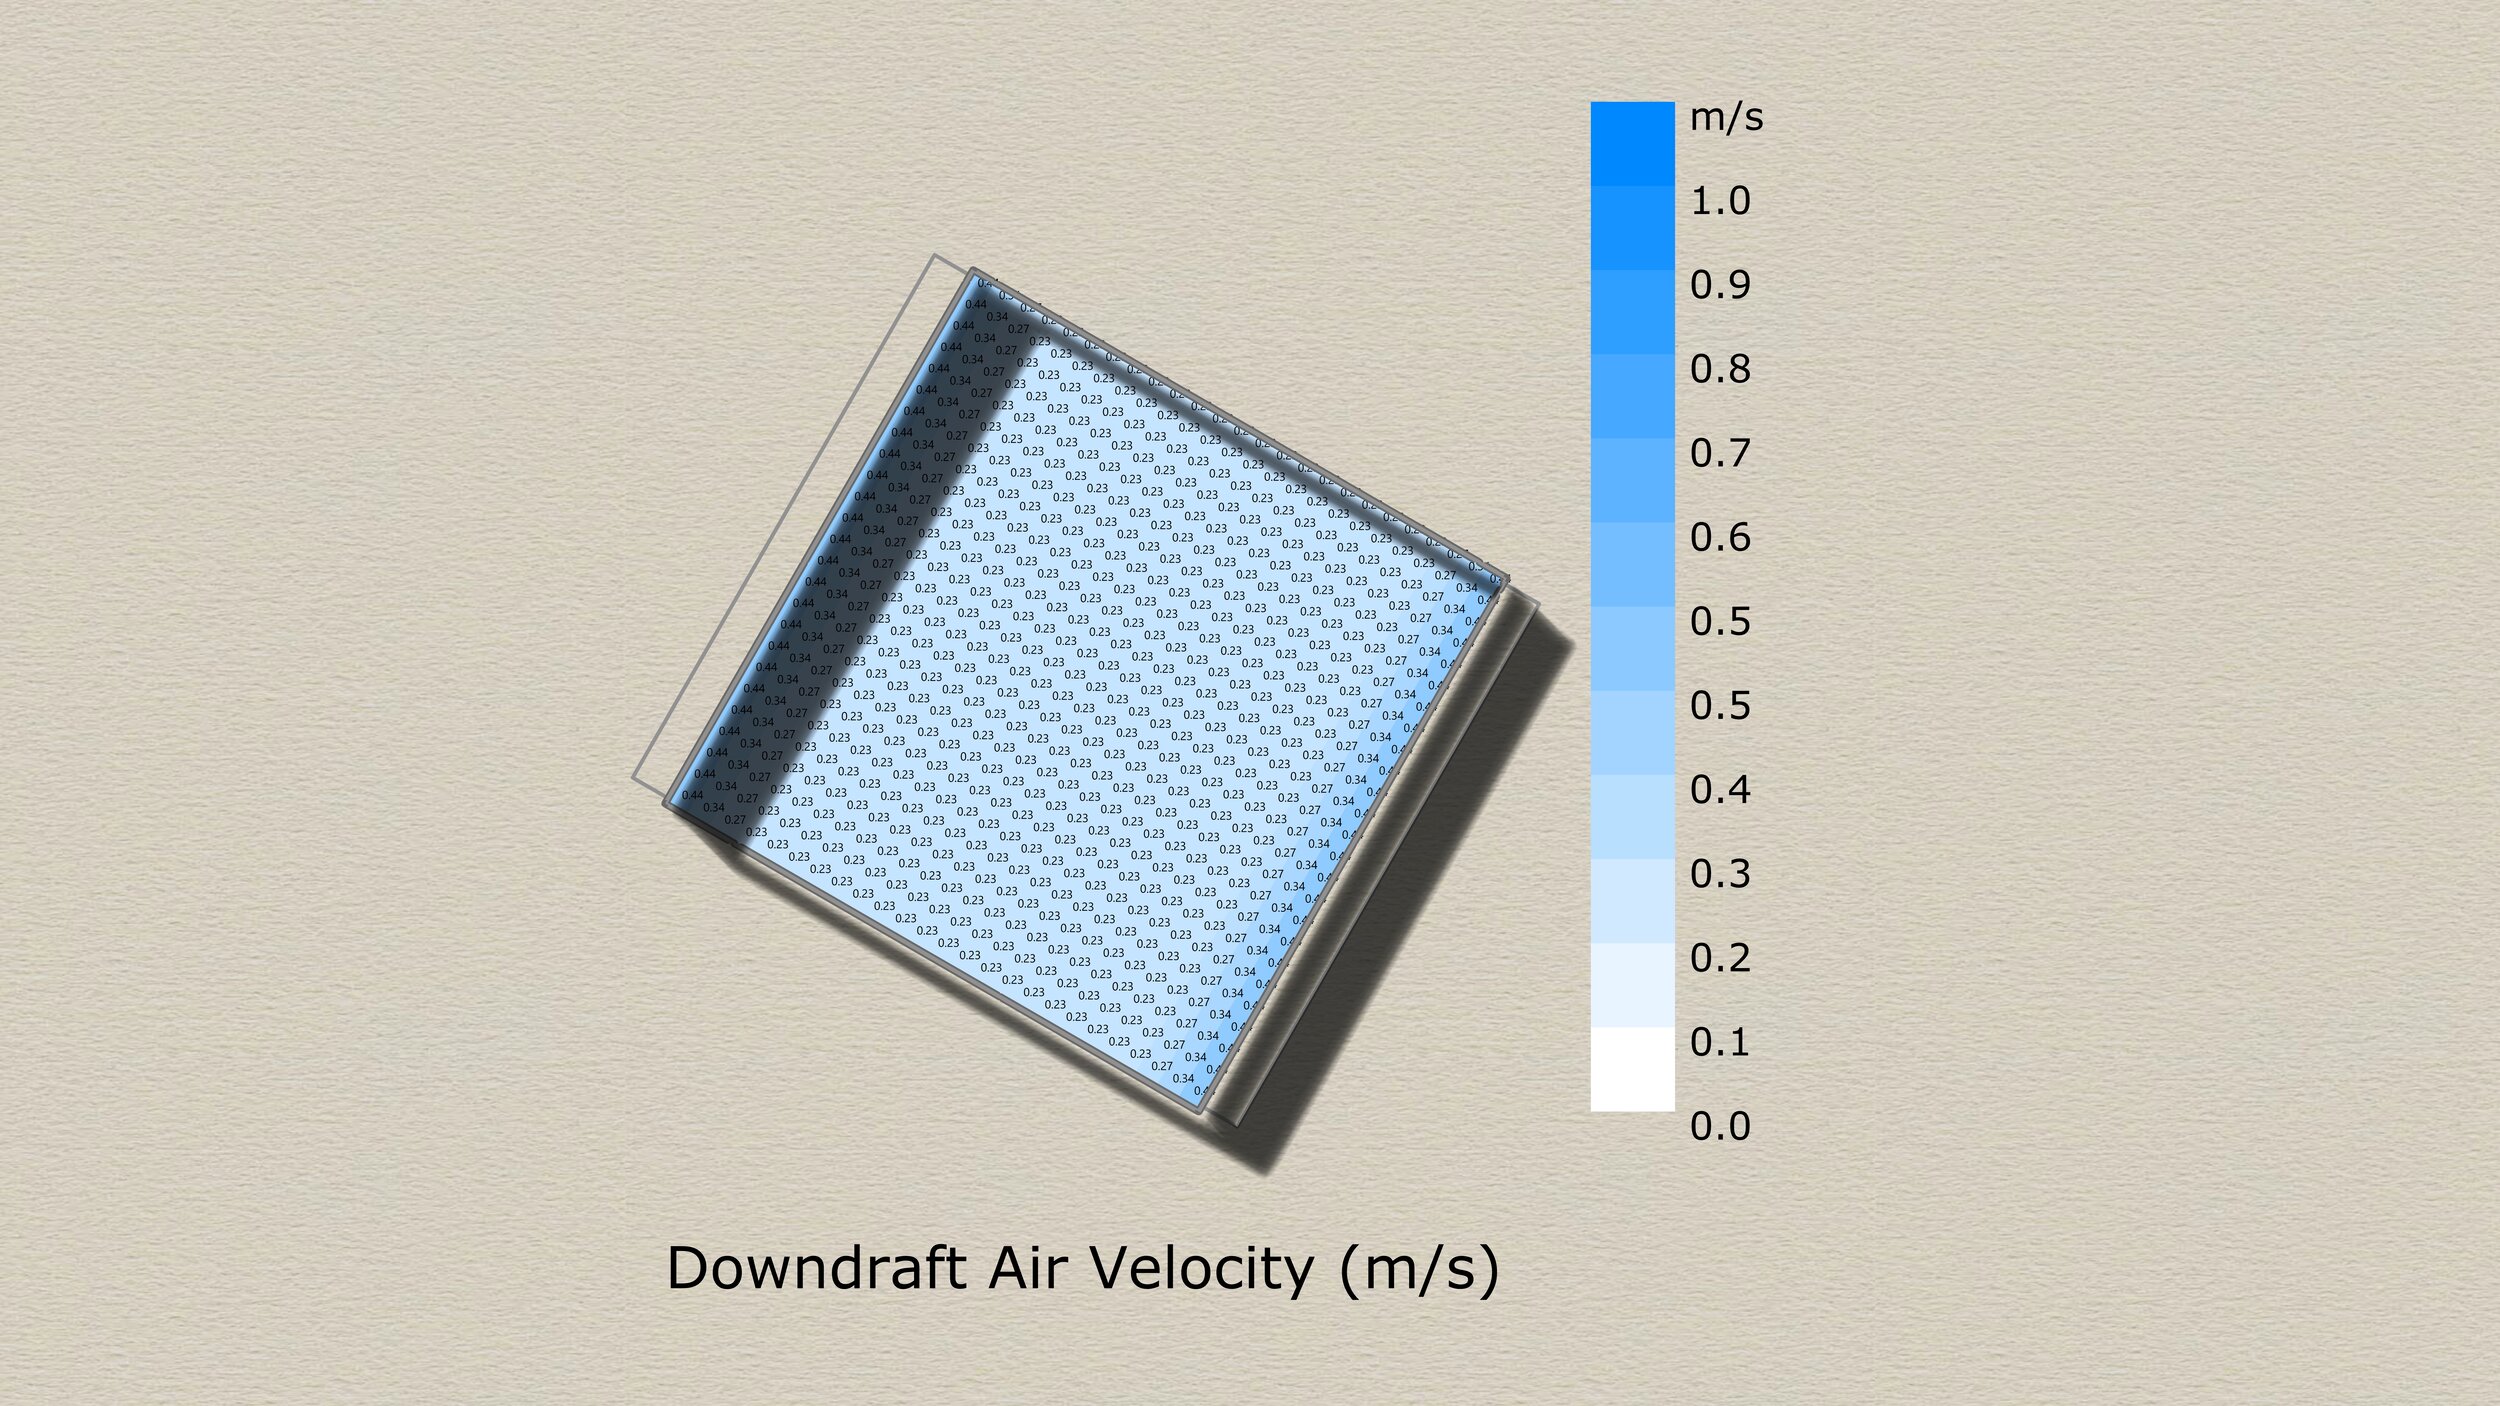
Average Percent of People Dissatisfied with Downdraft: 38.14%
Average Standard Effective Temperature: 23.03°C
Interior Downdraft Velocity: 0.25 m/s
Mean Radiant Temperature: 19.52°C
Relative Humidity: 40%
Clothing Level: 0.9
Metabolic Activity: Typing
Case 2
[All cases are oriented north]
Material Properties
Level 1
View Factor
Average Predicted Mean Vote: -0.6
Average Percent of People Dissatisfied: 12.65%
Average Percent of People Dissatisfied with Downdraft: 39.43%
Average Standard Effective Temperature: 23.05°C
Interior Downdraft Velocity: 0.26 m/s
Mean Radiant Temperature: 19.65°C
Relative Humidity: 40%
Clothing Level: 0.9
Metabolic Activity: Typing
Level 2
View Factor
Average Predicted Mean Vote: -0.62
Average Percent of People Dissatisfied: 13.07%
Average Percent of People Dissatisfied with Downdraft: 39.43%
Average Standard Effective Temperature: 22.96°C
Interior Downdraft Velocity: 0.23 m/s
Mean Radiant Temperature: 19.48°C
Relative Humidity: 40%
Clothing Level: 0.9
Metabolic Activity: Typing
6. Visual Comfort, Daylight and Glare Analysis
Case 1
[All cases are oriented north]
Glare on North Wall
Glare on South Wall
Case 2
[All cases are oriented north]
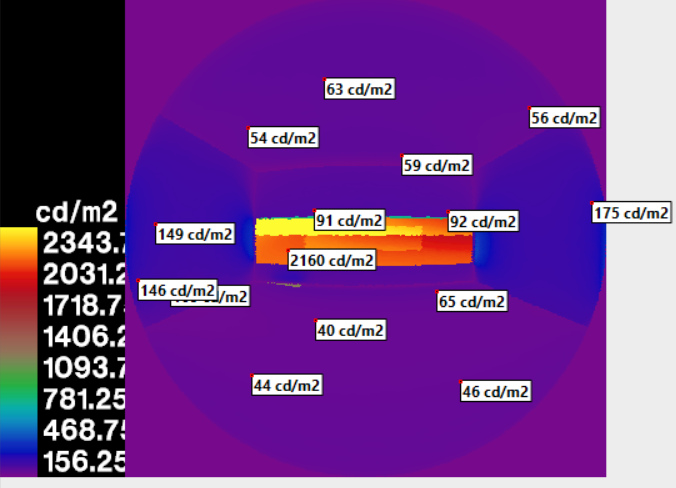
Glare
Level 1
View Factor for Desk placed in front of Northern Window
Level 1
View Factor for Desk placed in front of Southern Window
Level 2
View Factor for Desk placed in front of Northern Window
Level 2
View Factor for Desk placed in front of Southern Window
View Factor
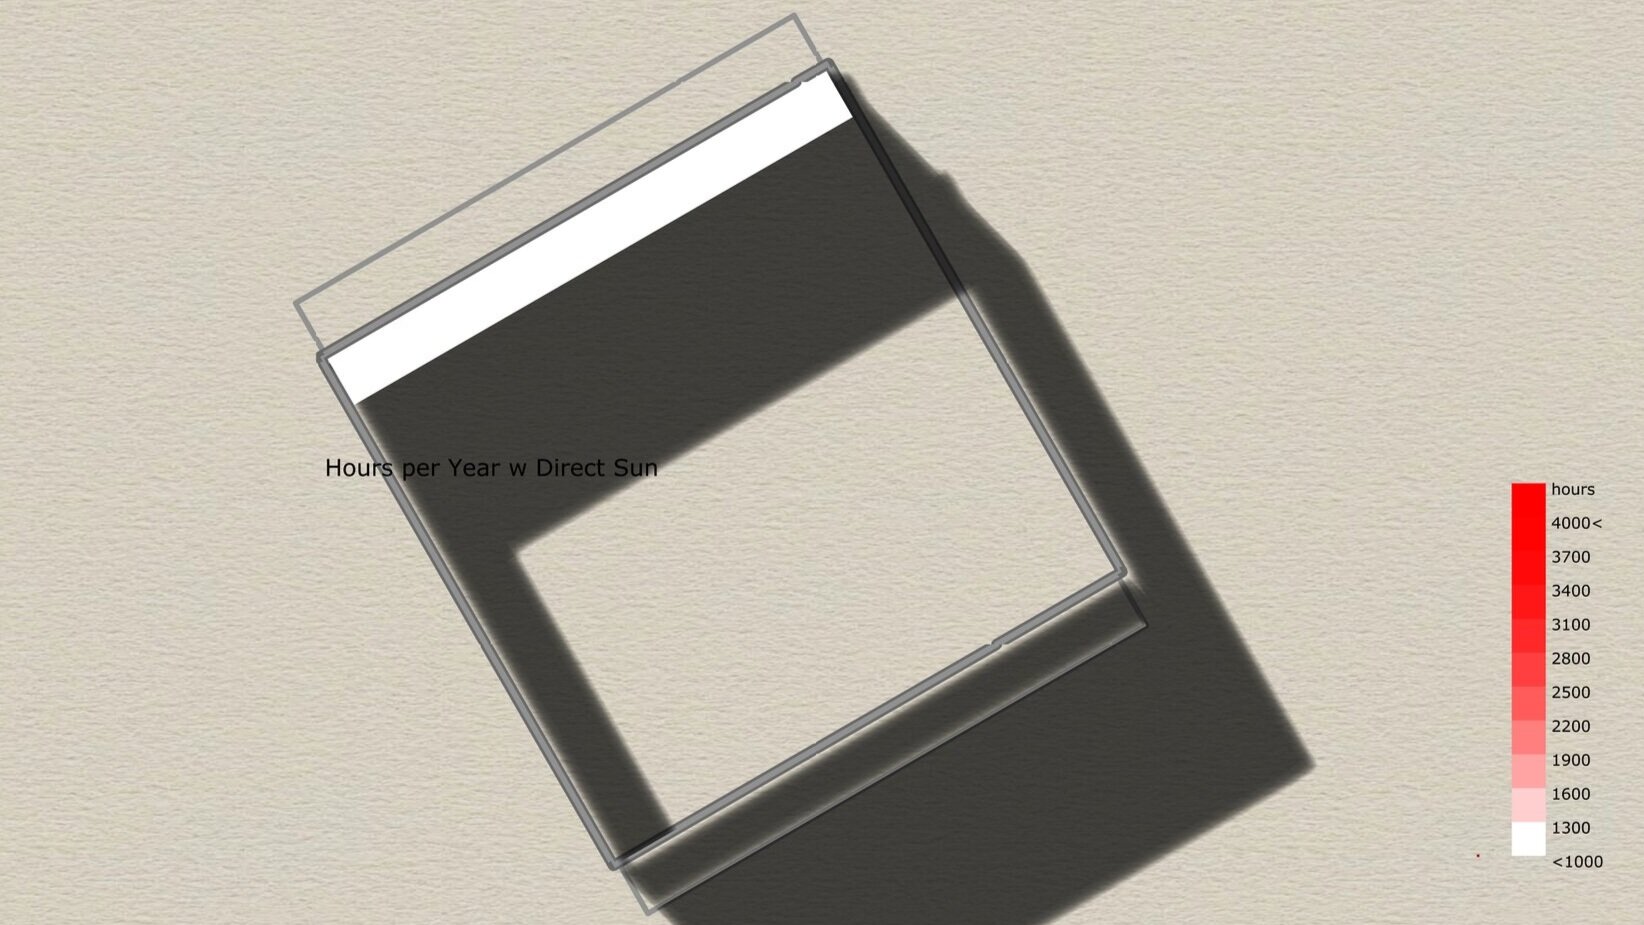
Sunlight Hours
Level 1 - North
Level 1 - South
Level 2 - North
Level 2 - South
OBSERVATION:
Case 1 has an Energy Use Intensity of 188 kWh/m2 and the modified design has an Energy Use Intensity of 209 kWh/m2. However, it can be observed that the comfort percentage of the two also differ, with the occupants of case 2 being more comfortable during the year than the occupants of case 1.
The useful daylight illuminance of case 1 is also lower. This is due to the high contextual buildings surrounding the site. Having more than one floor will ensure that there is enough useful daylight entering the space. This can be observed in case 2. When the building height was increased by to 10m from 5m, the useful daylight index increased. Subsequently, the amount of radiation and direct sunlight hours incident on the surface is also greater for the modified design, thus ensuring that more energy can be produced through PV panels than comparison. Glare is effectively controlled with the use of shading devices in conjunction with a higher performing glass.
CONCLUSION:
The performance of the building in terms of producing energy, comfort of the occupants, useful daylight index is higher in case 2 in comparison to the case 1. However, the base case has a lower Energy Use Intensity. With regards to achieving the best design, neither of the two iterations can meet all the criteria. I believe that case 1 is the better design out of the two. Modifications to improve performance was made in case 2 whereas the case 1 was generated with simple design strategies. If improvements were made to the material properties and glazing ratio of the case 1, it may perform better in terms of occupant comfort. The drawback of case 1 that cannot be rectified is the height of the structure. The structure is only 5m which is shorter compared to the surrounding structures that stand out at a height of 20m. This means there is a smaller threshold for useful daylight illuminance.


